Insights from Payoptify Team

Split-screen comparison illustration showing the evolution from basic Stripe dunning on the left (single email channel, 2019 interface) to advanced payment recovery on the right (multi-channel communication including email, SMS, and in-app notifications, modern AI-powered dashboard). The image visually represents the gap between outdated payment recovery methods and modern, intelligent dunning strategies that SaaS companies need in 2025.

Stripe's built-in dunning gets you started, but it's not enough for serious SaaS revenue recovery. Discover what you're missing and how to upgrade your payment recovery strategy.

Conceptual image contrasting outdated dunning, represented by tangled, dusty gears on a dim background, with modern AI-powered payment recovery, depicted as sleek, glowing neural network lines and a bright, efficient system on the other side, symbolizing a strategic upgrade for SaaS revenue.

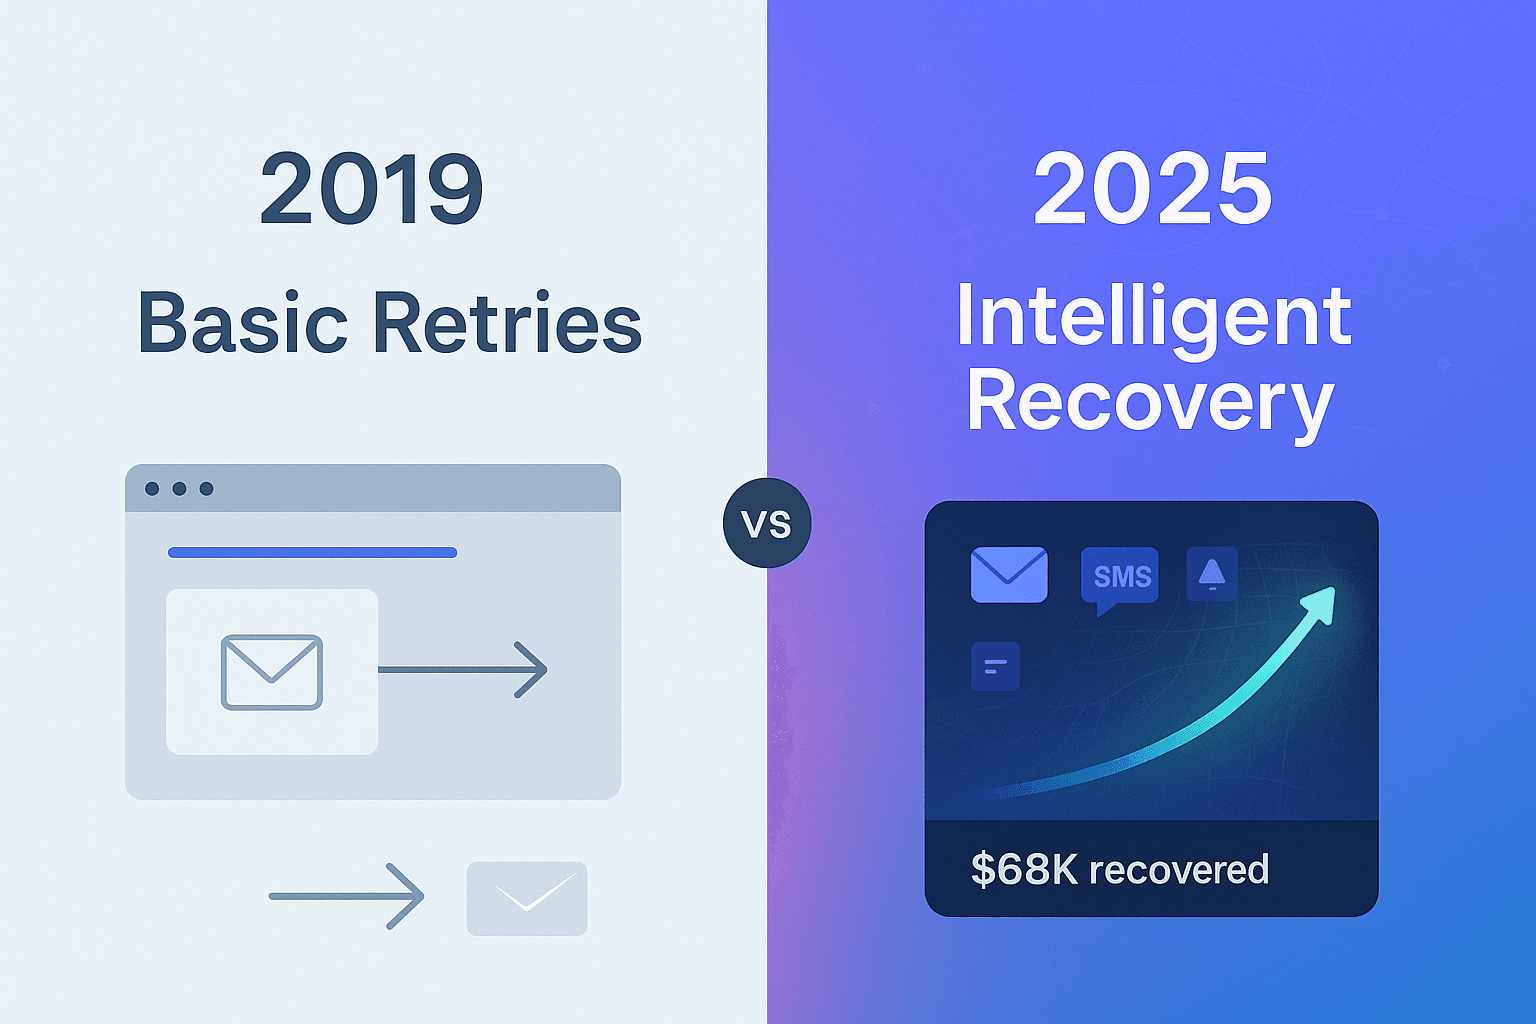
Still relying on outdated dunning? Discover why traditional payment recovery methods are failing SaaS businesses and how AI-powered solutions can dramatically reduce churn and boost revenue.

A modern, data-driven visualization showing the impact of failed payments on SaaS revenue, with a focus on recovery strategies

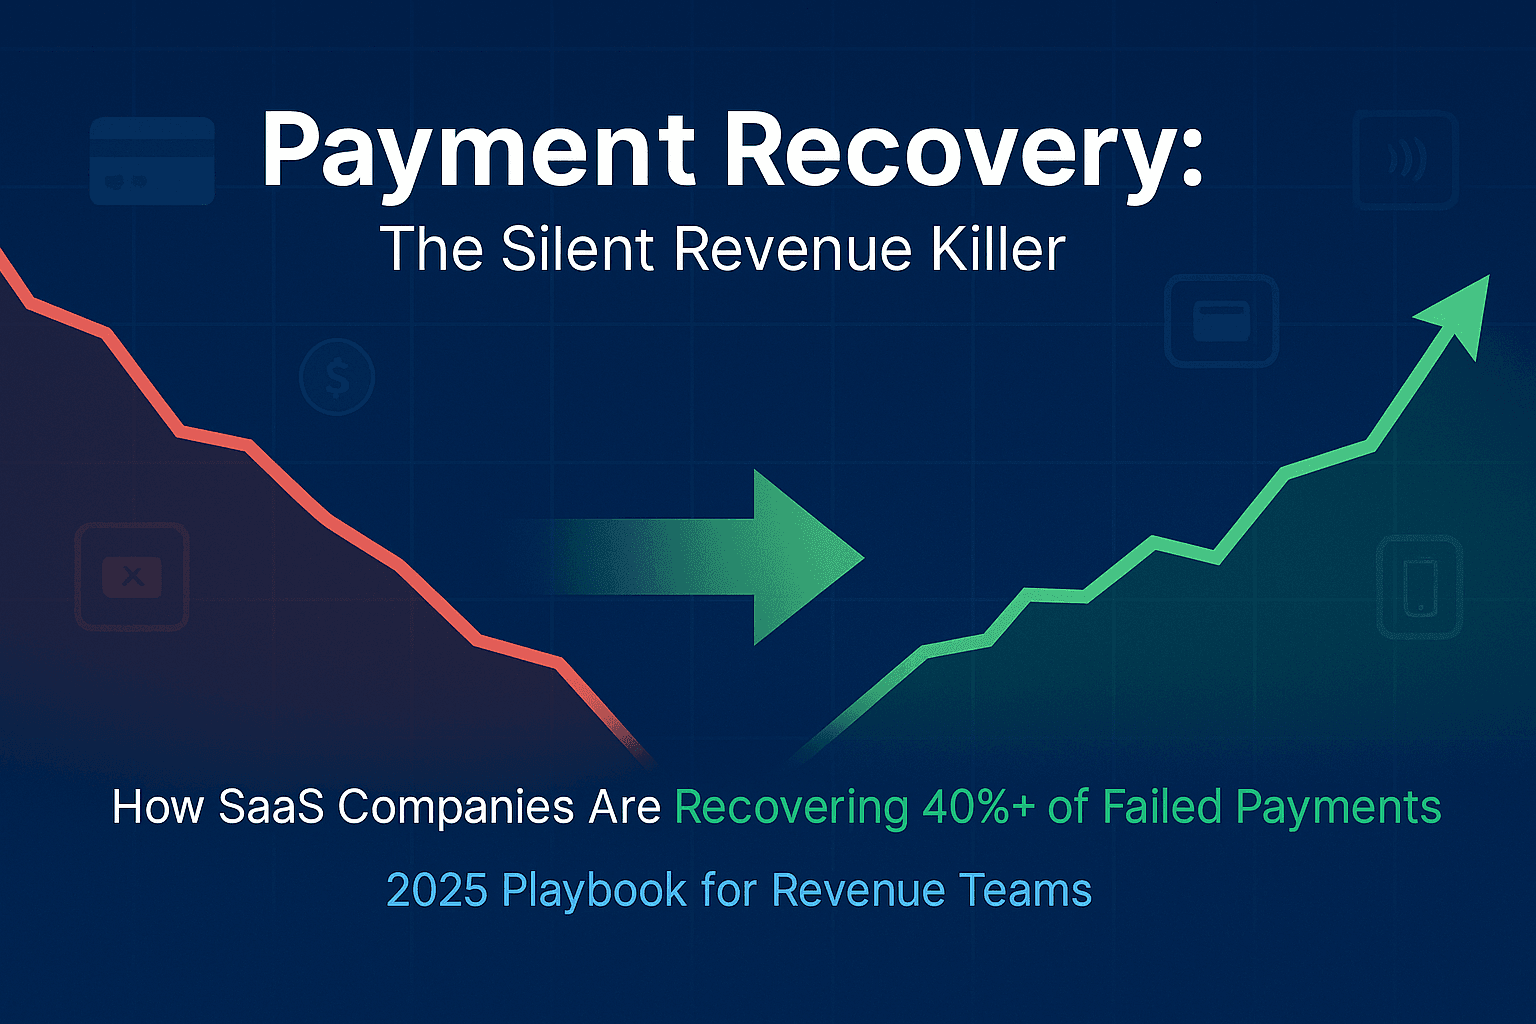
Master the art of payment recovery in 2025: Learn proven strategies, best practices, and advanced techniques to minimize involuntary churn and maximize revenue recovery for your SaaS business.

A split-screen visualization showing the contrast between chaotic multi-processor payment management (left) and streamlined unified recovery (right). The left side shows multiple browser windows with different payment processor dashboards (Stripe, PayPal, Adyen) at 3 AM, with red alert notifications and scattered sticky notes. The right side displays a clean, modern unified dashboard with clear metrics, organized recovery statuses, and a calming blue color scheme. The image should convey both the stress of managing multiple systems and the relief of having a unified solution.

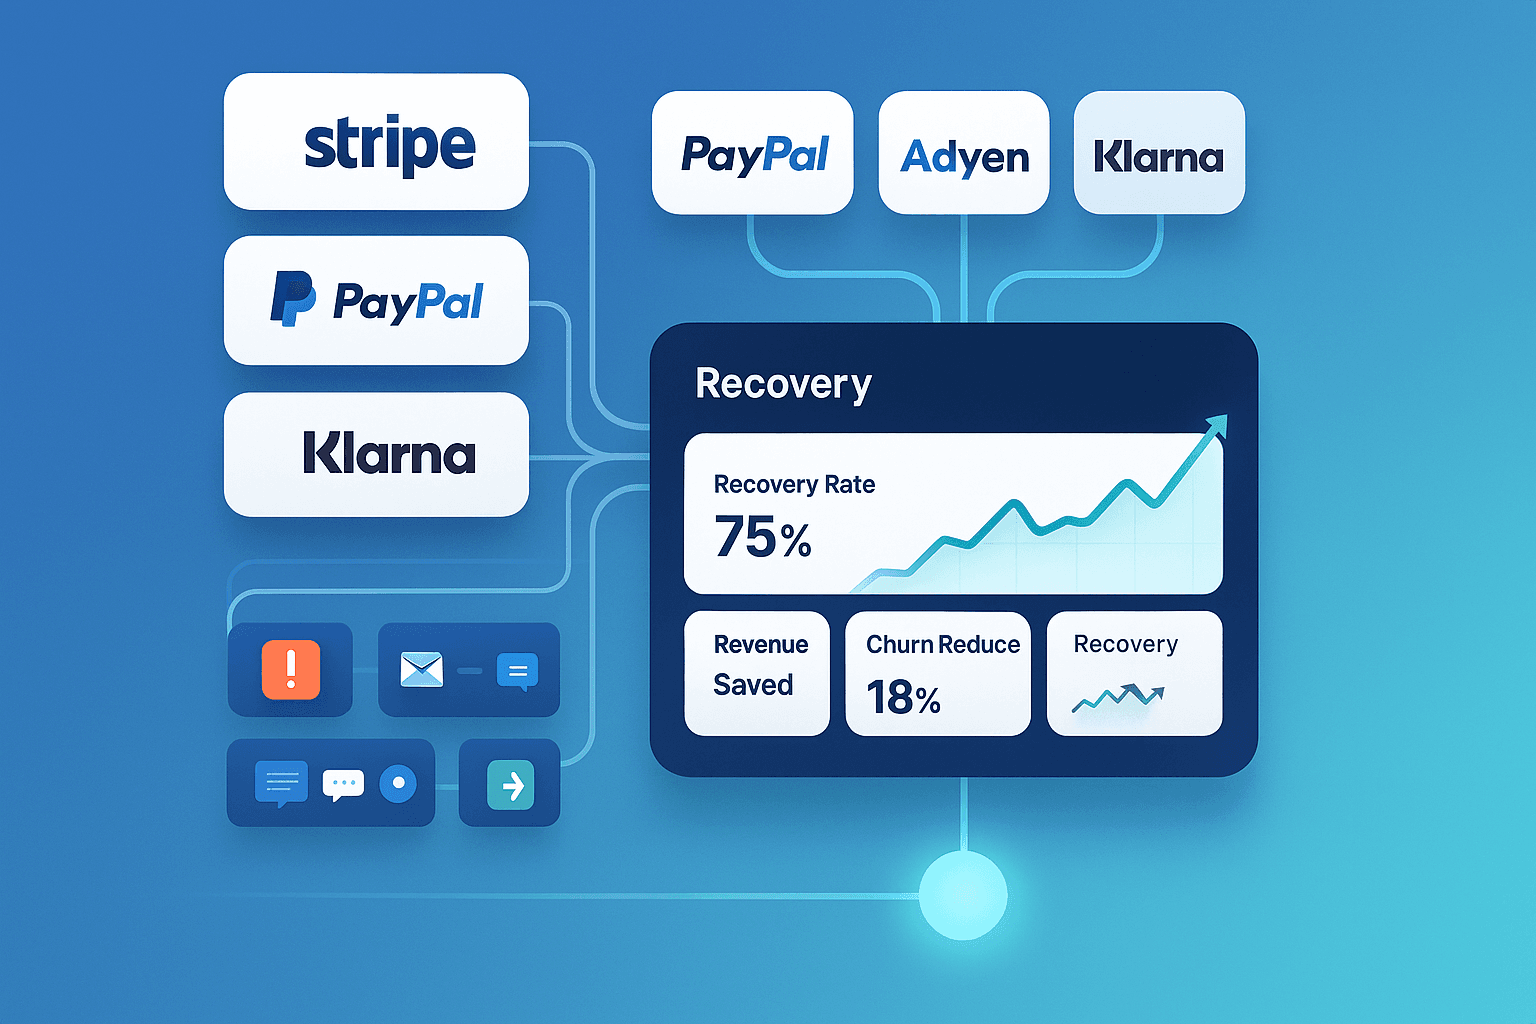
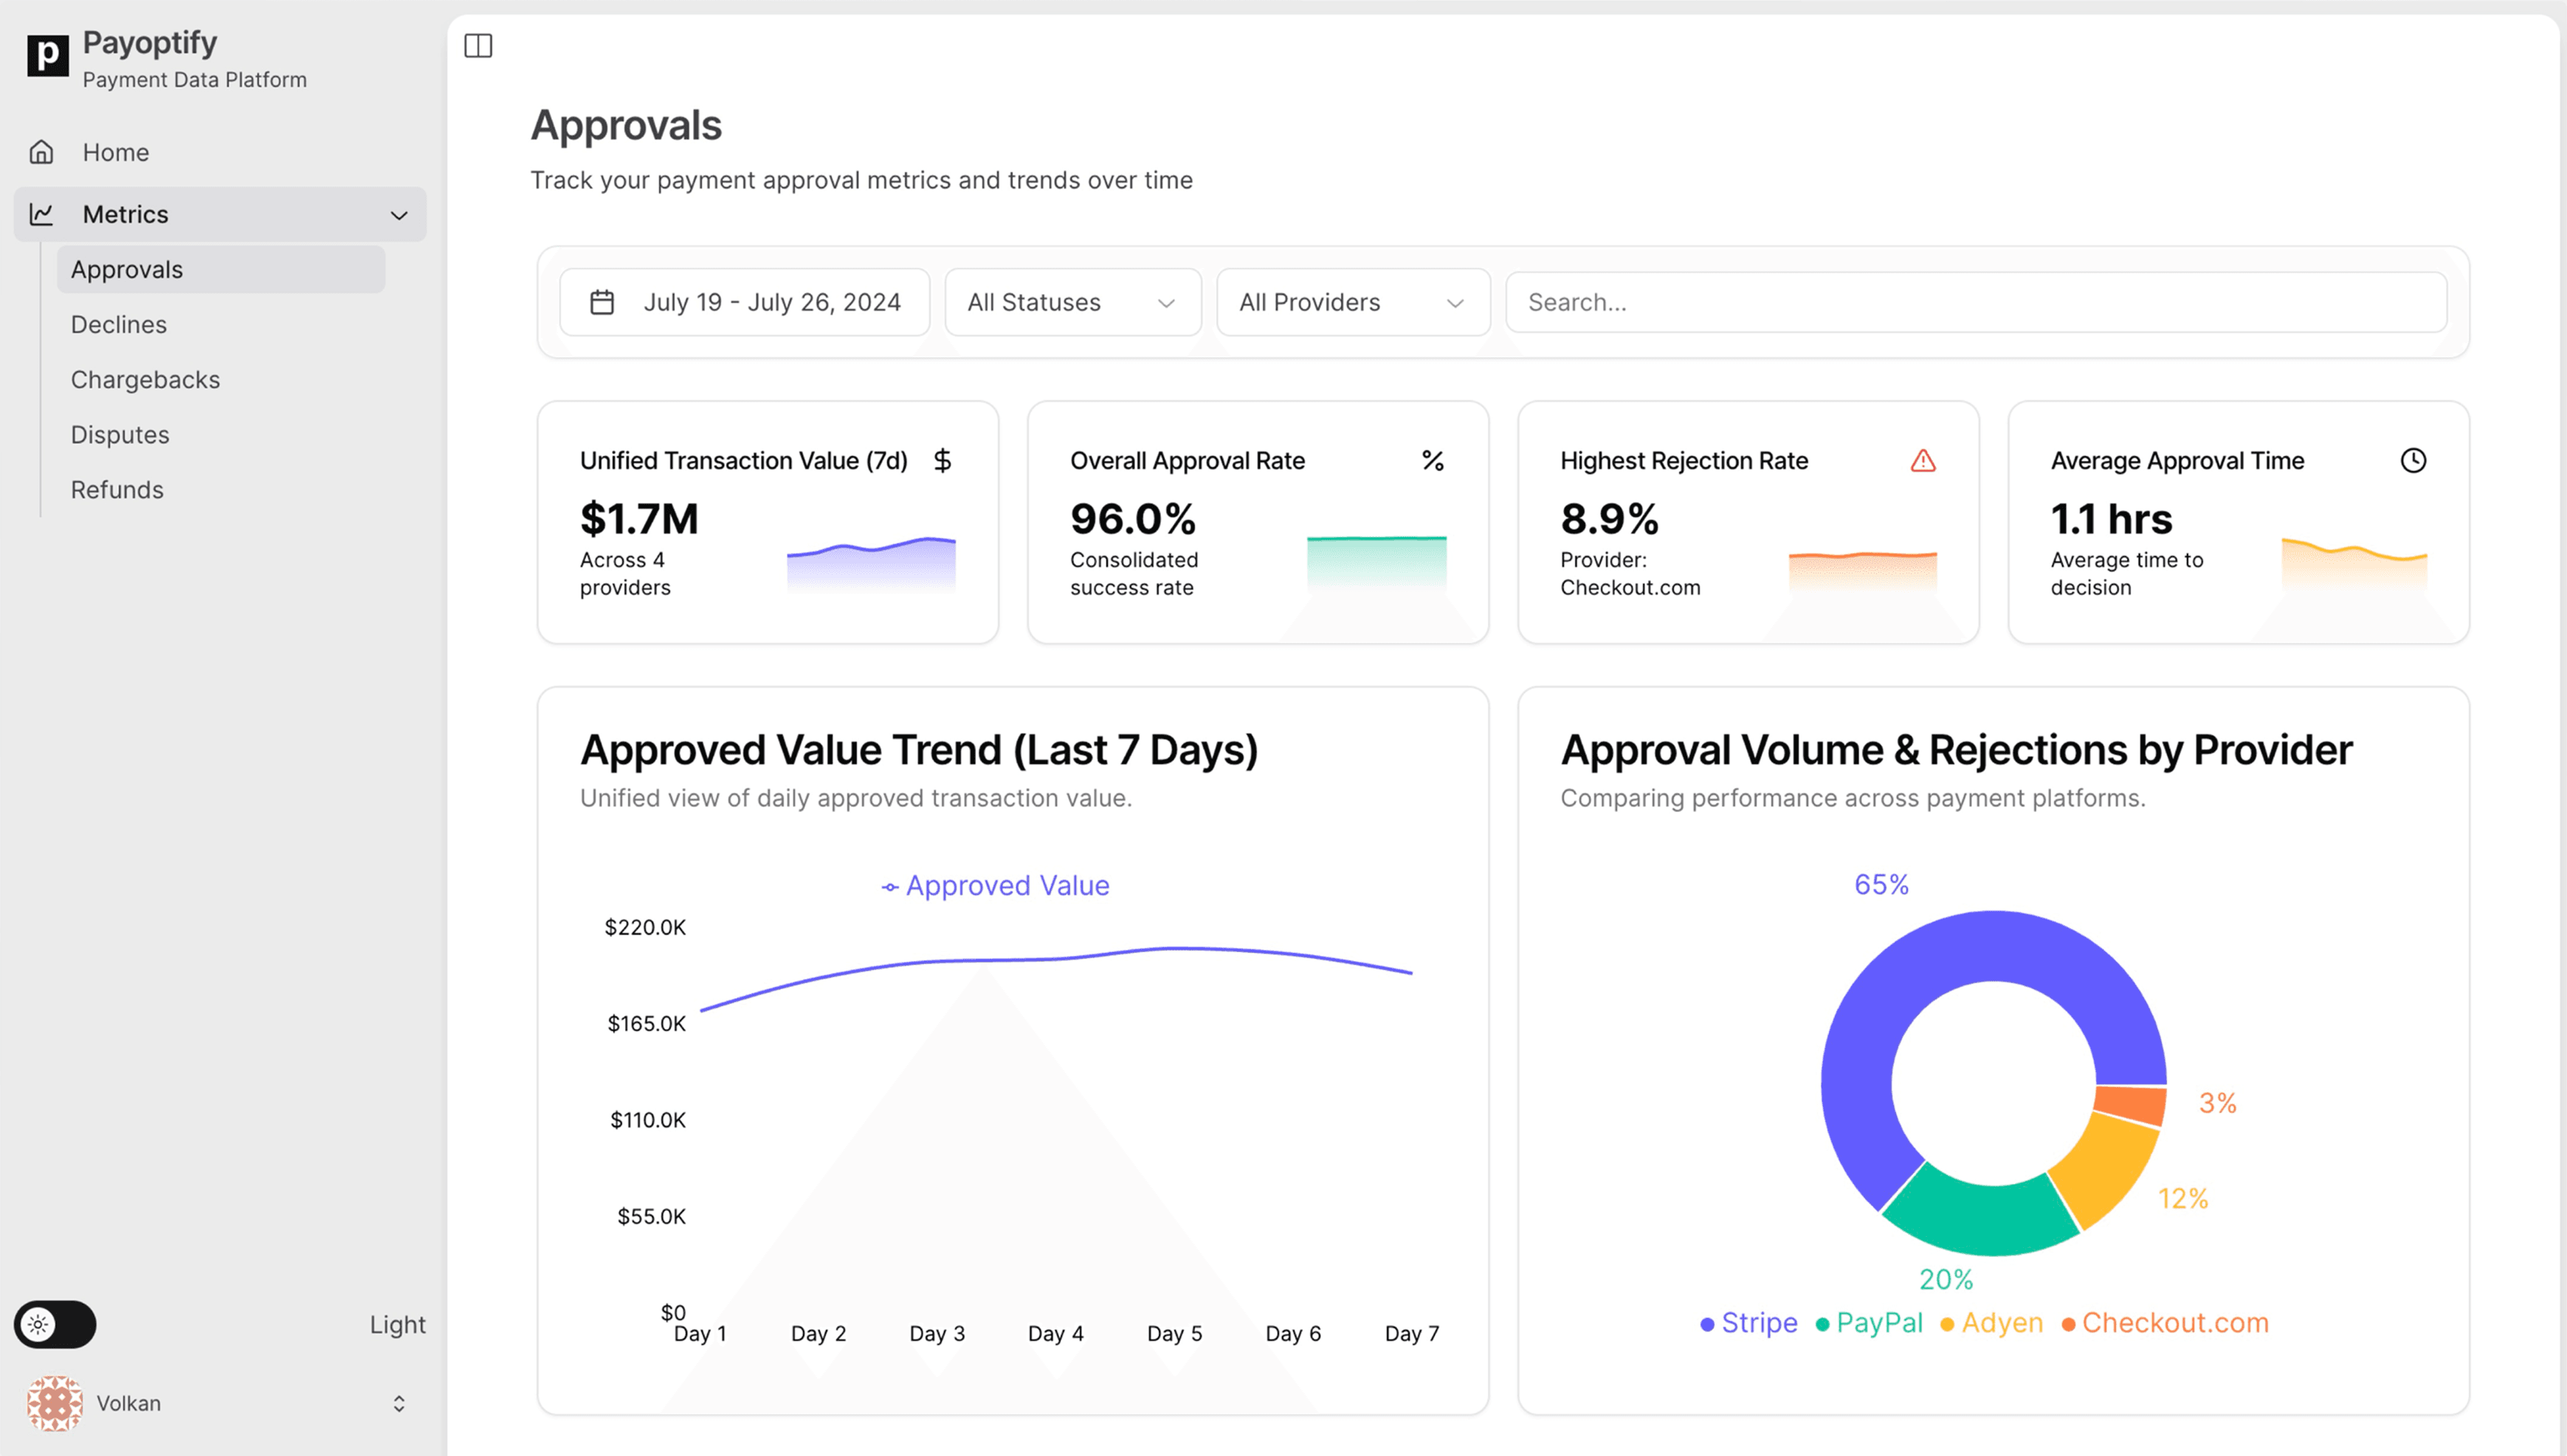
Juggling dunning across multiple payment processors? Learn how a unified recovery platform can streamline your efforts, reduce churn, and boost revenue.

A modern, intuitive dashboard that brings together payment recovery data from multiple processors into one unified view. See your recovery metrics, track success rates, and monitor revenue impact across all your payment providers in real-time. No more switching between platforms or missing critical information.

Discover what involuntary churn is, how it silently drains your revenue, and how to calculate its true cost to your SaaS business.

A split-screen visualization showing the contrast between voluntary and involuntary churn. On the left, a customer actively choosing to leave (voluntary churn), represented by a person walking away from a service. On the right, a customer being disconnected due to payment issues (involuntary churn), shown through a broken payment card or transaction. The image uses a professional color scheme with blues and grays, maintaining a clean, business-focused aesthetic that resonates with our target audience of finance and revenue operations professionals.

Explore the critical differences between voluntary and involuntary churn, their unique impacts on SaaS businesses, and effective strategies to combat both types.

Explore how failed payments can distort your marketing metrics, leading to misguided strategies and wasted resources. Learn how to address these issues to ensure accurate performance metrics and enhance your marketing success.

Explore how failed payments can distort marketing performance metrics and what you can do to address this issue.

Digital illustration of a green sapling with data stream-like roots, some frayed or disconnected, being repaired by a glowing magnifying glass with an analytics symbol, symbolizing SaaS business growth through data insights.

Learn the essential metrics for tracking and understanding involuntary churn, how to calculate them, and what they reveal about your SaaS business's payment health.

A conceptual image representing customer churn in a SaaS business. Imagine a series of interconnected, stylized user profile icons or abstract blocks forming a stable structure.

Deep dive into customer churn: understand what it is, how it's calculated, why it's a critical metric for SaaS businesses, and how to start tackling it.

Digital art: Business person confidently walks a clear path labeled 'Merchant of Record' through a complex maze of global currency, tax, and legal icons, heading towards open market access.

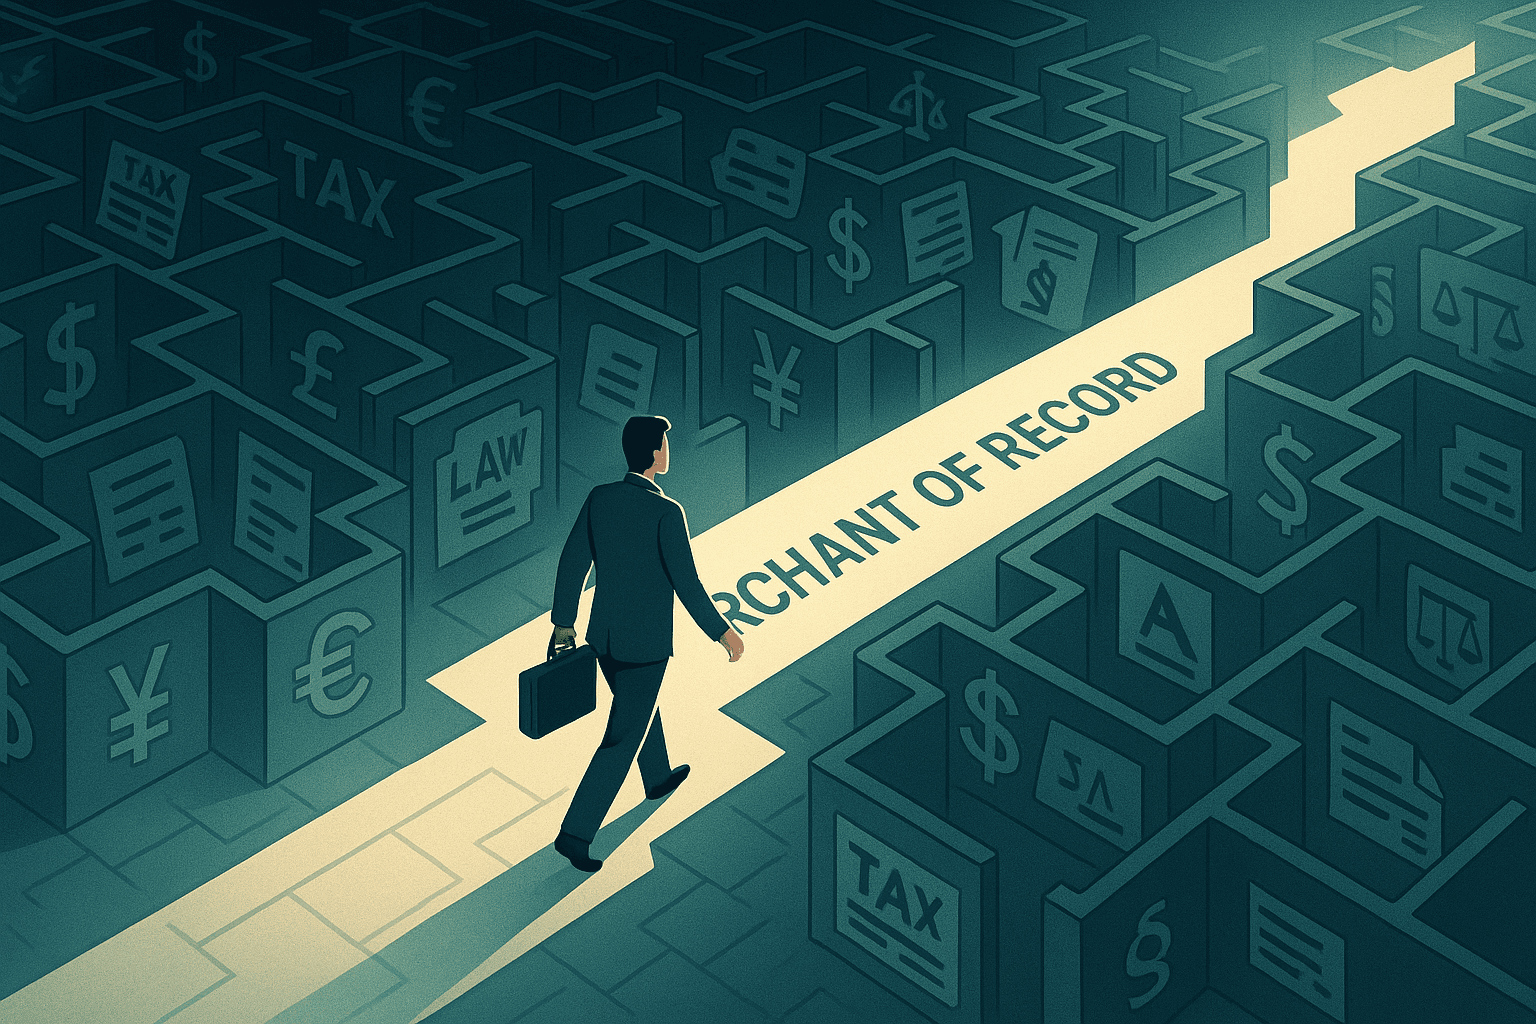
Understand what a Merchant of Record (MoR) is, how it works, and why it can be crucial for businesses, especially those selling internationally or dealing with complex tax and compliance requirements.

Professional business setting with hands interacting with a secure digital interface on a tablet, conveying data integrity and control over financial information.

Learn the essentials of payment data security to protect your business and customers from potential threats. A crucial guide for finance and operations leaders in SaaS & e-commerce.

Digital artwork illustrating a clear, luminous path navigating through a complex maze of global currency symbols and financial data, symbolizing the successful management of cross-border transaction fees.

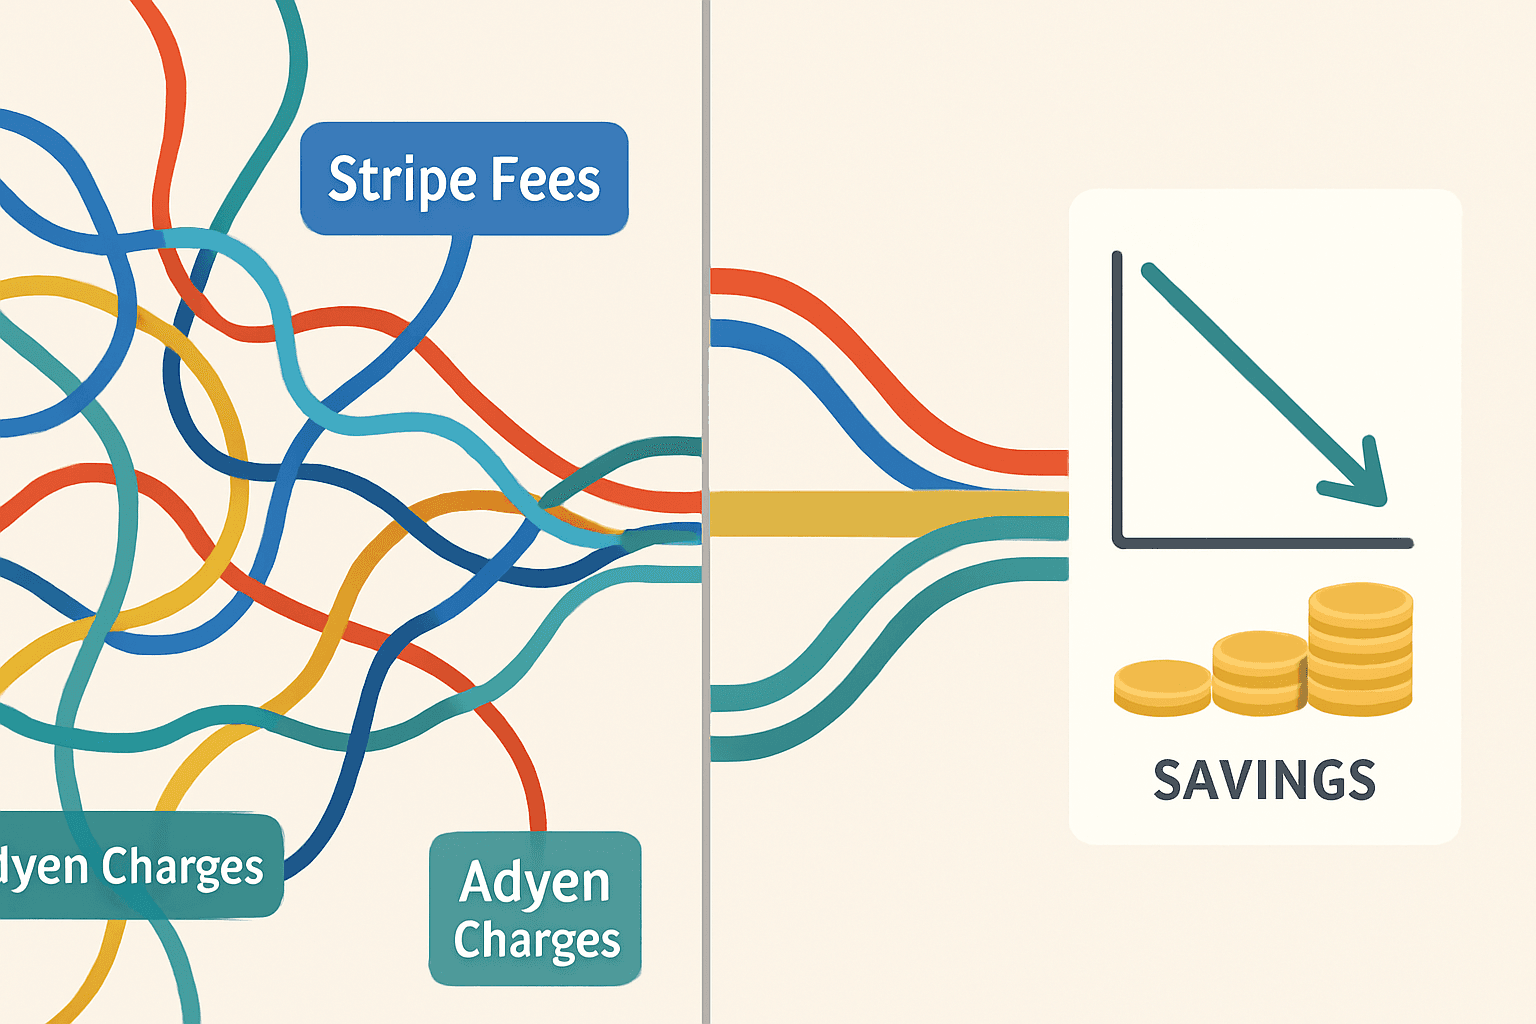
Simplifying global payment fees: Learn practical ways to manage and reduce costs for your international business.

Illustration of ascending steps leading to a secure payment icon, symbolizing a clear guide for new businesses setting up online payments in 2025.

Embarking on your new business venture? This step-by-step guide will walk you through everything you need to know about accepting online payments in 2025, from choosing the right tools to understanding fees and security.

Illustration of a computer screen displaying logos of top payment gateways like Stripe, PayPal, Square, and Shopify, with the title 'Choosing Your Payment Gateway: A 2025 Comparison of the Top 10 Options' on a blue fintech-themed background.

A finance-focused comparison of the top 10 payment gateways in 2025. We cut through the hype to analyze features, true costs, and integration complexities relevant to your bottom line.

Modern tablet screen displaying a clear financial dashboard with a highlighted section indicating Stripe insights, symbolizing financial clarity.

Is Stripe just another payment processor, or a critical piece of your financial data puzzle? We break down its core features, benefits, and real-world considerations for finance pros.

Abstract illustration of diverse payment methods unifying into a streamlined central pathway, symbolizing how a Payment Service Provider (PSP) simplifies complex online transactions and provides clarity.

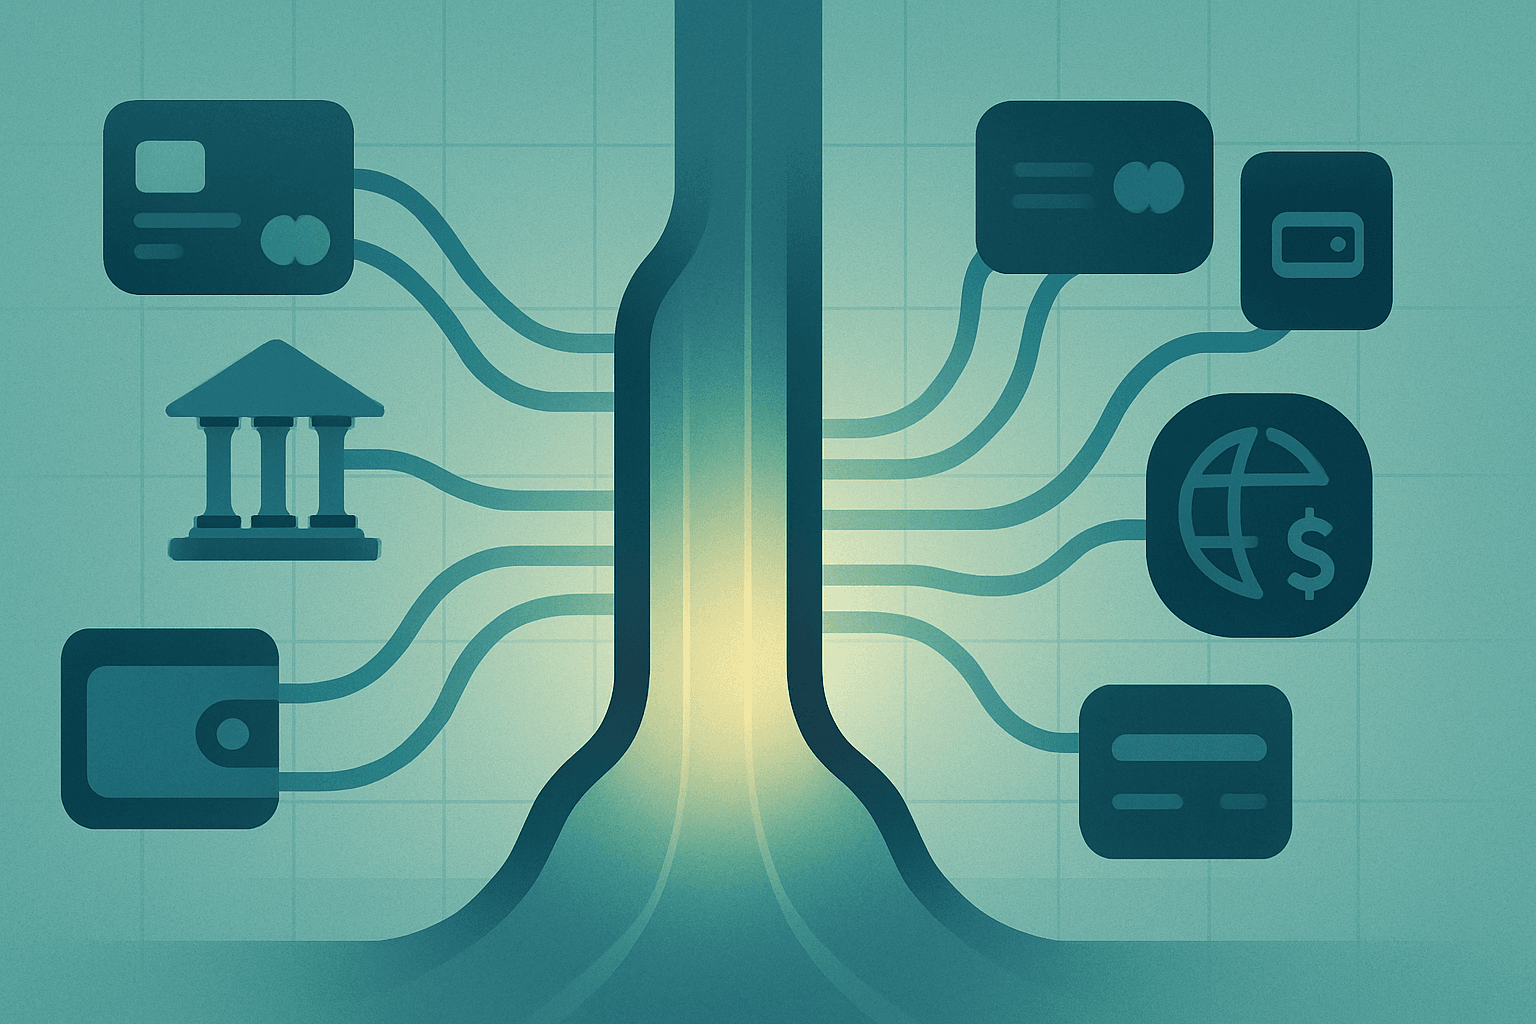
A clear explanation of what Payment Service Providers (PSPs) are, their crucial role in online transactions, and how they function to facilitate seamless payments for businesses and customers.

Illustration representing business confidence and control achieved through optimization, shown by a satisfied owner.

Discover how a SaaS company leveraged unified payment analytics to identify hidden processing costs, reduce revenue leakage, and significantly improve profit margins.

Visualizing the impact of unified payment analytics: On the left, the chaos of fragmented data from multiple providers like Stripe, PayPal, and Adyen. On the right, these disparate streams are unified into a single pipeline, providing the clarity needed to drive down costs and unlock savings, represented by the downward trend and gold coins.

Fragmented payment data obscures hidden costs and wastes valuable analyst time. Discover how unified analytics tools like payoptify deliver cost transparency and unlock significant ROI.

Vector illustration showing an overwhelmed finance professional buried in disparate payment spreadsheets and reports, with a large faded clock overlay symbolizing time wasted on manual reconciliation.

While payroll often gets the most scrutiny, payment processing frequently ranks as the second-largest operational expense. Learn why optimizing payment costs is critical for profitability and how unified analytics can help.

Cluttered desk showing fragmented payment reports with tangled data lines and errors, contrasted by a central tablet displaying unified data creating a clear, positive financial chart. Illustrates the cost of data chaos vs. the clarity of unified analytics.

Fragmented payment data silently drains profits through wasted reconciliation time, costly errors, and missed insights. Learn how unified analytics reveals the true financial impact.

Payoptify Dashboard

Transform payments from a cost center to a growth driver using unified payment analytics to maximize revenue, control costs, prevent fraud, gain customer insights, and experiment strategically.

Vector illustration showing complex line graphs transforming into a single, clear, upward-trending graph on a stylized dashboard element, representing increased profitability achieved via financial insights from payment data.

Stop leaving money on the table. Unlock hidden profit potential by leveraging the financial insights buried in your payment data. Discover five actionable strategies.

Get Expert Insights on Payment Finance

Subscribe to our newsletter for deep dives into payment optimization, cost reduction strategies, and financial data analytics.